
To display location-related data on a Google Map component, use the following general procedure:
The following video shows an example of this process, including the definition of a callout that displays location-specific data when the map marker is clicked.
To create layers that you can show and hide, add Map Groups to your Google Map and populate the map groups with the desired data.
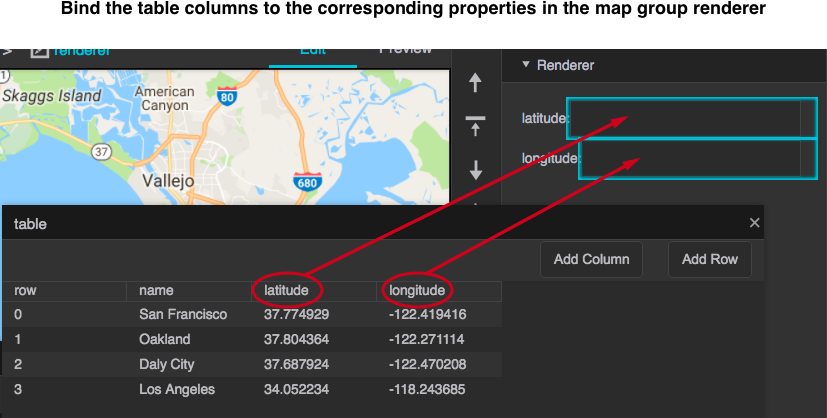
To populate a map group with multiple components, perform the following steps:
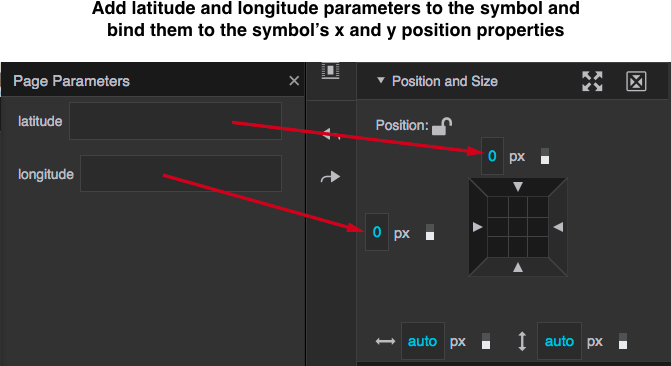
If you have specified the settings and bindings correctly, your symbol is displayed at all the location in your source table. If there is additional location-specific data that you want to display with the symbol, add table columns for the data and create addition symbol parameters and bind them from the corresponding table column. The source table can be dynamically populated from a database or script in the dataflow.
To apply JSON styles to a map, paste the JSON code for the styles into the map's mapStyles property. You can obtain predefined styles from SnazzyMaps' web site and you can define map styles using the Google Maps APIs Styling Wizard.
Edit the mapType property.
The default initial zoom level is 10, and the default initial location is San Francisco, CA. To change these settings, edit the Latitude, Longitude, and Zoom properties.
In the Property Inspector, under Map, edit the Map Controls property.